Sweat, sensors and transmitters
Working on his position on the time trial bike, triathlon pro Florian Angert is making the best of the compulsory competition-break. Now it was time to verify the results – in a gebioMized field test.
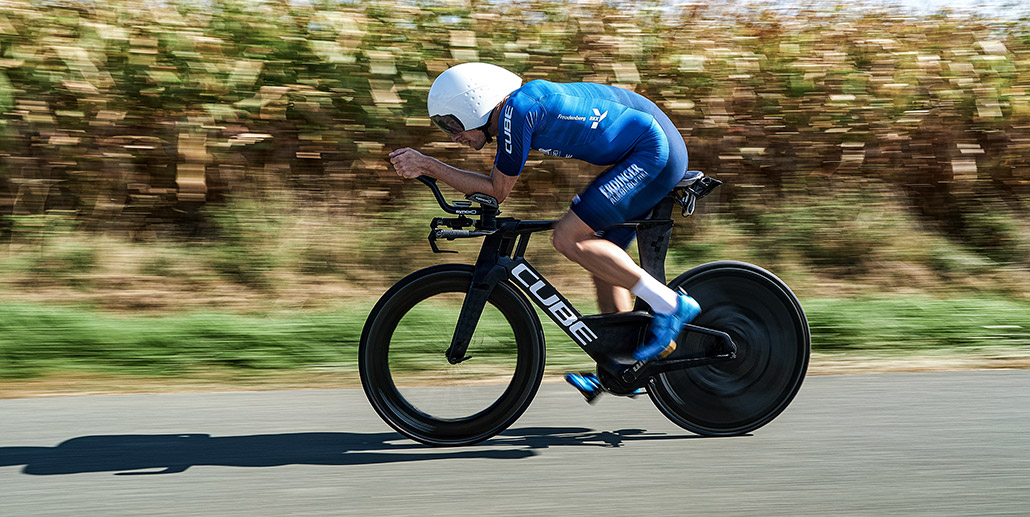
It is a warm Monday morning in September, just one day after the Pushing Limits Race in Ratingen. About 100 kilometers northeast of Ratingen, something blue in aero position speeds through the Münsterland region: a triathlete in the colors of Team Erdinger Alkoholfrei.
A closer look reveals: it is Florian Angert. The 28-year-old triathlon pro won Ironman Barcelona in 2019 in a new record time – and, just as a footnote, he also set the fastest Ironman rookie time ever in his long-distance debut.
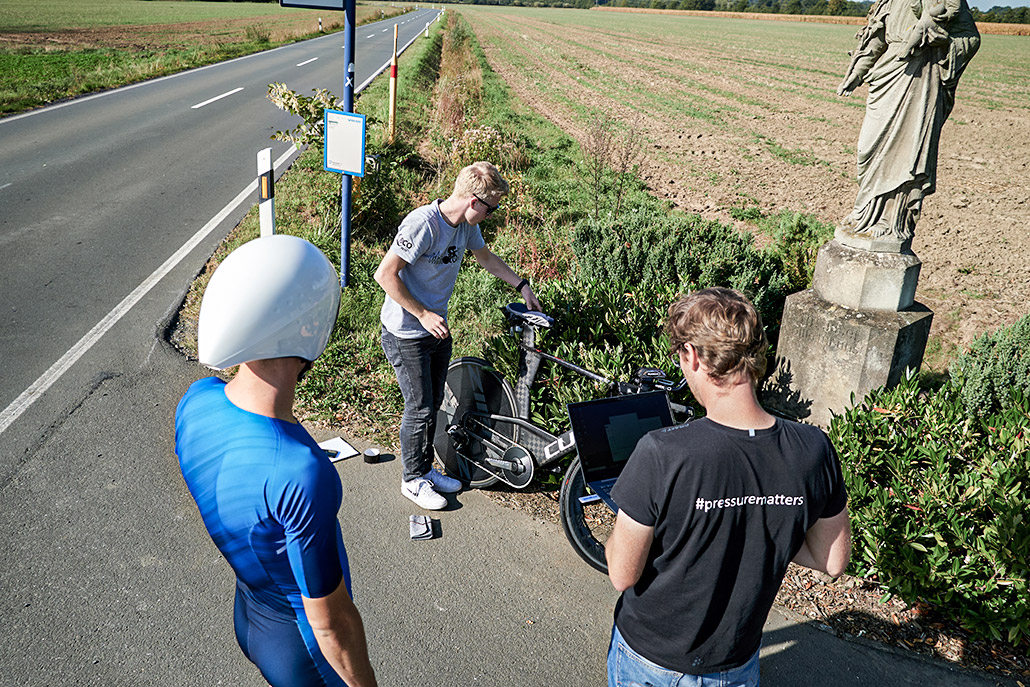
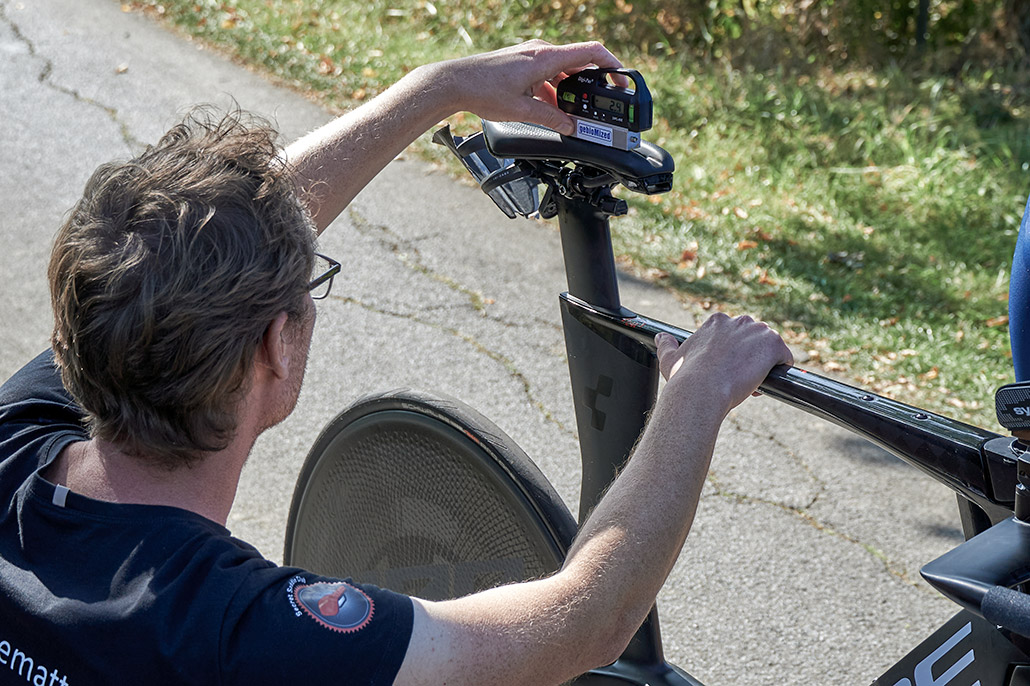
But today something is different. With transmitters, sensors and pressure measurement foils mounted, his triathlon bike almost looks like a Formula 1 car. This setting can only mean one thing: Florian Angert does not just speed through the Münsterland region for fun. It is a test ride for the GebioMized fitting crew. The mission is to further improve the seating position, to get the most out of the potential of the athlete-and-bike unit, to make a really fast setup still a little bit faster. It is a mission which is worth working and shedding some sweat for even on a Monday after a race weekend.
But let’s start from the beginning: This year Florian already was on the track and in the wind tunnel with his bike fitter Raphael Jung from Diagnose Berlin. Now he is right in the middle of field testing. The goal is to analyze his seating position in detail, especially with regard to biomechanics and aerodynamics, in an environment where speed and load are to simulate the racing action as closely as possible.
“I took advantage of the involuntary race break to work on my race setup and position. I am especially eager to check whether the adjustments made during wind tunnel testing work on the road, too, and whether I am capable of riding this position and if I can further optimize it”, says Florian.
The fitting crew around Daniel Schade and Jan Neuhaus are especially interested in the following questions:
- How stable is Florian’s CdA-value over a longer period of time under race load? When and how much do the measured data change?
- Are certain position changes advantageous or disadvantageous with regard to aerodynamics and stability?
- How does the athlete compensate for higher resistance in terms of position?
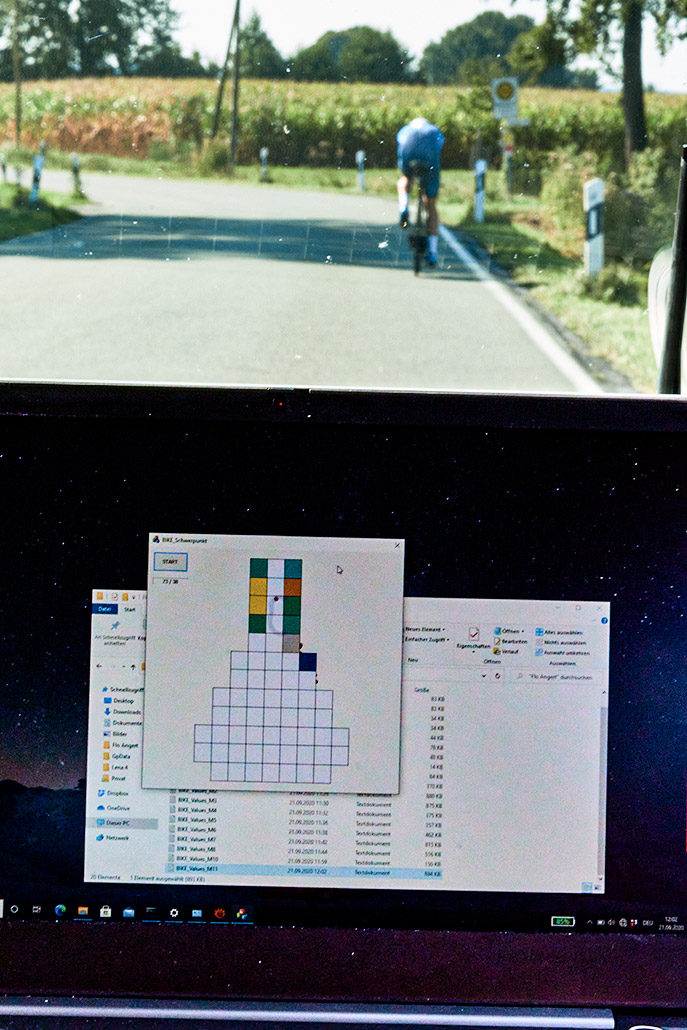
This approach is supposed to create as holistic a position profile of the athlete as possible. It is exactly for this purpose that the gebioMized fitters use their complete technical arsenal. Technology they could work with in any Formula 1 pit crew as well. A special wind gauge at the cockpit records the aerodynamic values. A large number of sensors, attached to Florian Angert’s body at various points, record the movement pattern, and thanks to the high-speed pressure measurement foil, fitters can even measure in real time how stable Angert sits on the saddle, while following him in their support vehicle.
Small changes and valuable insights
Florian Angert completes a full 24 measurement runs with this setup. The result: lots of data, quite a lot of sweat and a first assessment by the sports scientists. “The test protocol worked great, the results speak for themselves”, says test manager Daniel Schade who is satisfied and reveals: “We knew that Flo already had a very good position on the bike. Nevertheless, we found a few improvable details, which we can now work on together”. As an example, Daniel mentions the minimal adjustment of the pad position, which increases the stability of the whole system of bike and athlete at high resistances, or the further optimization of the saddle position. “This leads to even less pelvic movements,” says Daniel.
All in all, the tests resulted in some small but very valuable adjustments and findings, which Florian can already use to his advantage in the next races. Maybe already at Challenge Daytona in December. We keep our fingers crossed – and are excited to see how this journey will continue.
In detail
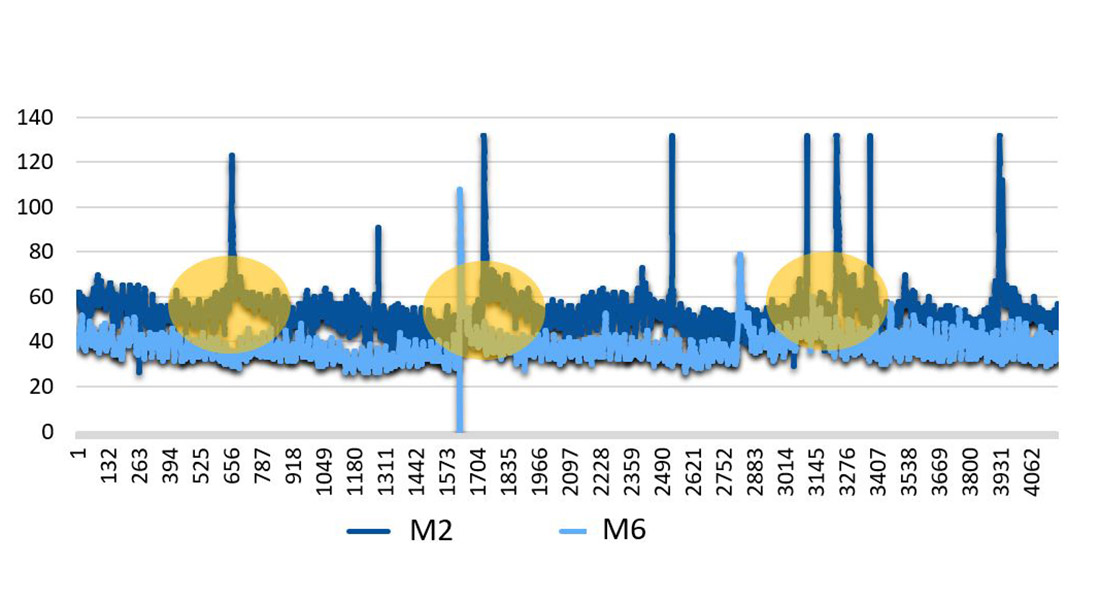
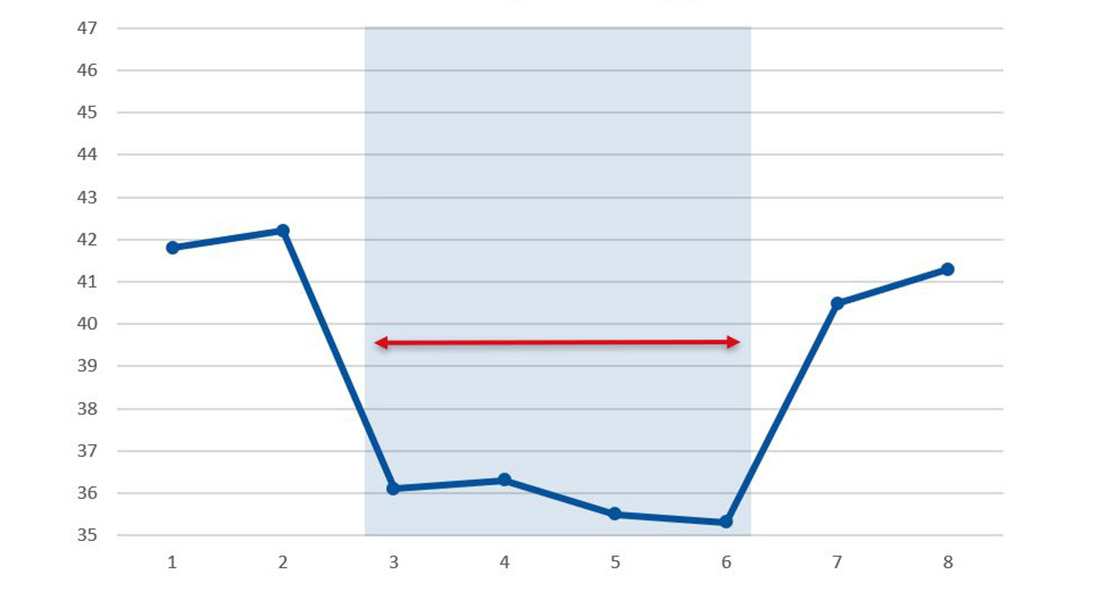
To give you an example to the loads of data, let’s have a look at two charts.
Y-movement in comparison
Chart 1 illustrates the movement of the point of force application on the saddle in longitudinal direction. The graph compares two test rides that Florian Angert completed in different postures. It becomes clear at first glance that the dark blue curve that depicts the first test ride shows several deflections, which we define as so-called shifts. The light blue curve that represents the second test ride, however, shows that the pelvis movements on the saddle are reduced, which indicates that saddle stability has increased. (Which test ride was the faster one remains of course a secret that must be kept at this point).
Pelvis angle
Chart 2 shows the pelvis position in the test runs 1 to 8. It is obvious that Florian has a very good pelvic tilt and that he is able to actively tilt his pelvis (runs 3-6). This ability is especially important for good aerodynamics, as it is the prerequisite for corresponding optimizations in the cockpit area. Once he is in this active position, the effect “reverberates”, so that the normal position benefits from a stronger pelvis tilt, too (rides 7+8).

